Hotel Kīlauea
Credits:
Data:
U.S. Geological Survey Hawaiian Volcano Observatory
Sonification algorithms:
Ben Holtzman and Leif Karlstrom
Music:
Leif Karlstrom - violin
John Mailander - violin
Adam Roszkiewicz - prepared guitar
Ethan Jodziewicz - prepared bass
Data animation:
Zack Marlow-McCarthy
Appears on Dreams and Circumstances by Small Town Therapy on Organic Records, copyright 2019.
Listener's Guide
Hotel Kilauea tells the story of volcanic unrest over 10 years, compressed into three minutes - a synthesis of the natural rhythms and melodies at an active volcano.
Kīlauea volcano and the raw data
Kīlauea is a restless volcano on the big Island of Hawai’i. The data associated with this recording and animation tell a story of volcanic re-awakening over 10 years. After decades of reduced activity, between 2003 and 2007 the supply of magma rising from Earth’s mantle within the Hawai’ian hotspot dramatically increased1. This deep influx of magma to Kīlauea volcano culminated first in a shallow intrusive episode where magma came close but did not reach the surface on June 16-17 2007 (the “Father’s Day” intrusion), and then caused the opening of the Halema’uma’u crater on March 19, 2008. This volcanic vent was open (and hosted a lava lake!) until the eruption of May, 20182 when the lava lake drained and the crater collapsed catastrophically.
The Hawaiian Volcano Observatory on Kīlauea, established in 1912, recorded a variety of signals that documented this dramatic series of events. We merged three data streams taken in the time interval between 2000-2010 for this audio-visual depiction of the action. Global Positioning System (GPS) measurements1 taken across the summit of the volcano record a long baseline swelling of the ground (Figure 1A). Tiltmeter records of days-long deformation episodes (called “Deflation-Inflation” events3, Figure 1B) show more localized, transient underground magma motions in the shallow subsurface. Measurement of sulfur dioxide (SO2) gas flux at the surface1 (Figure 1C) tracks the eruption rate of magma at the surface.
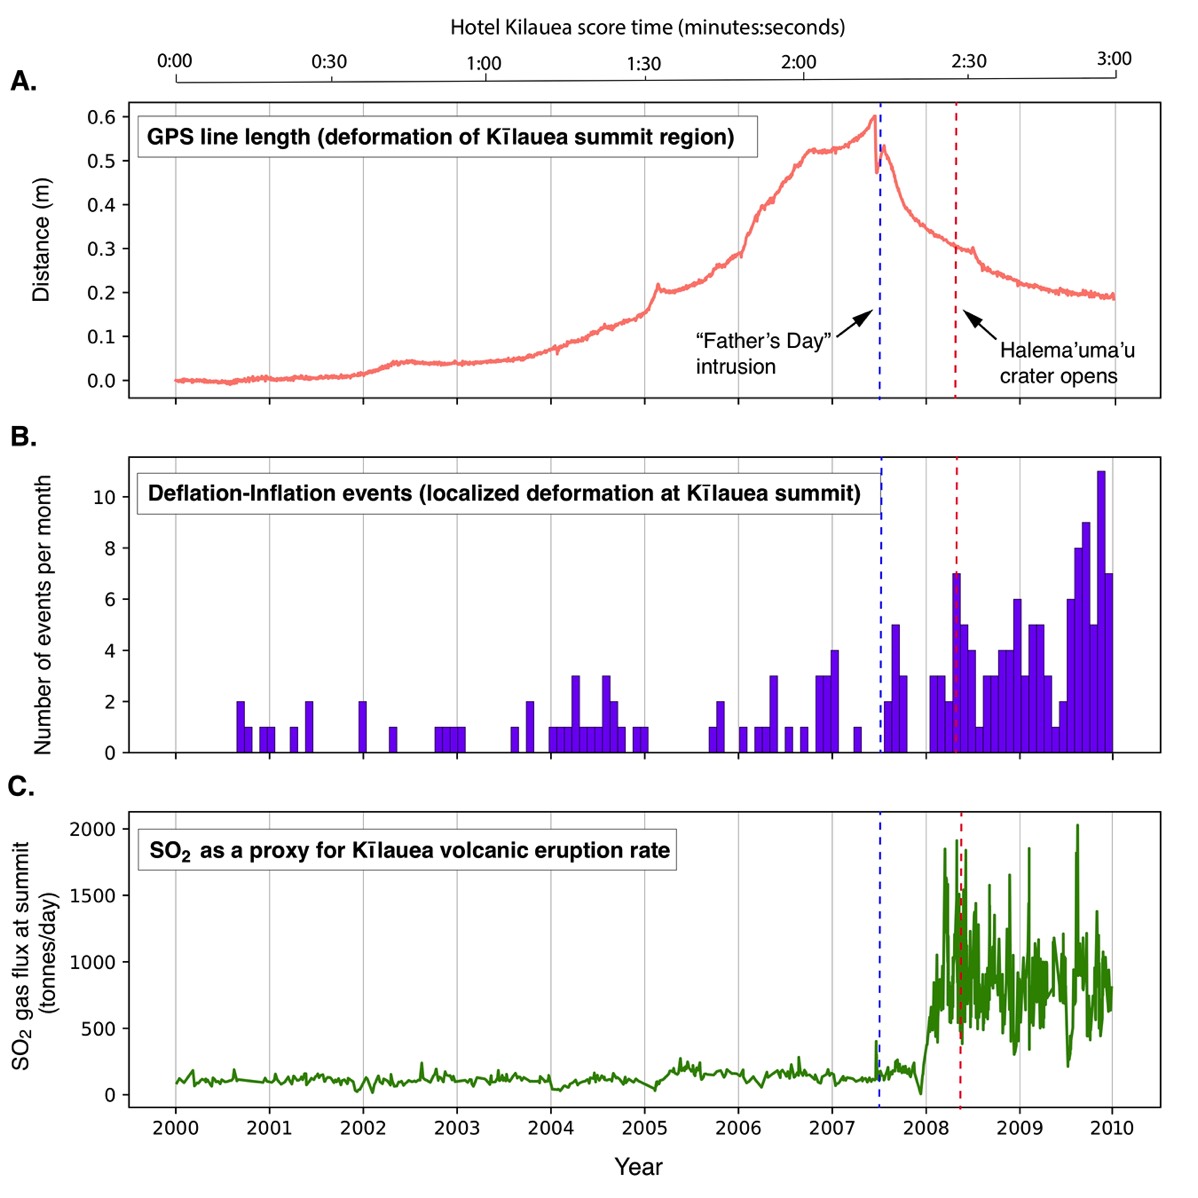
Figure 1. Data from the Hawaiian Volcano Observatory, taken at Kīlauea volcano between 2000-2010 during a period of increased magma flux, which culminated in the opening of Halema’uma’u crater in 2008. The top axis shows the score time for the multimedia piece “Hotel Kilauea”. The vertical blue dashed line is the Father’s Day intrusion, while the red dashed line in the opening of Halema’uma’u crater. (A) GPS distance between two stations on opposite sides of the summit crater, giving a “line length” that varies as the volcano swells up. (B) Occurrence rate of Deflation-Inflation ground deformation events near the summit of the volcano. (C) Measured SO2 gas emissions near the summit, which is a proxy for the volume of magma erupted.
Sonification
The representation in Figure 1 is a “traditional” way to present data: numerical values associated with signals recorded at the volcano are plotted on a graph, and we can observe relationships between the signals. For example, notice that GPS data record a deflation coincident with the Father’s Day magma intrusion, and SO2 emissions spike up around the opening of Halema’uma’u when magma reached the surface as a lava lake.
Sonification of the Kīlauea data provides a different way to understand these patterns, by representing the volcanic data with sounds that faithfully represent the quantitative information recorded by scientific instruments. Ben Holtzman at Columbia University and I had to come up with some new techniques to do this (credit for these techniques goes almost entirely to Ben, I merely provided support and tested things out). One might say that the music was composed by the volcano, but arranged by us!
We used a different approach to sonification for each data stream. For the GPS data, we developed a “weighted chord” sonification that uses an octatonic or diminished scale (a very symmetric and jazzy-sounding scale) to map GPS line length onto pitch clusters in a low frequency range. This gives a sonically broad, fuzzy picture of the rising and falling of the volcano surface, representing slow deformation that occurs over a long time relatively deep beneath the surface. For the Deflation-Inflation deformation episodes, we used the onset of events and their magnitude to create sound “bursts” with loudness and pitch associated with the data values. For the SO2 flux, we mapped the timeseries (in tonnes per day) of gas coming out of the ground to frequency directly, using a high register to emulate the more rapid movement of magma flowing at or near the surface. To make things interesting, we sped up all of the data by a factor of more than a million – ten years in three minutes!
Listen to the raw sonified data on Sound Cloud
Directed musical improvisation
The sonified data alone is an interesting scientific product. Just like a graph, we can listen for patterns and relationships between the datasets. We can develop a story to explain the patterns and hopefully understand the natural world a bit better.
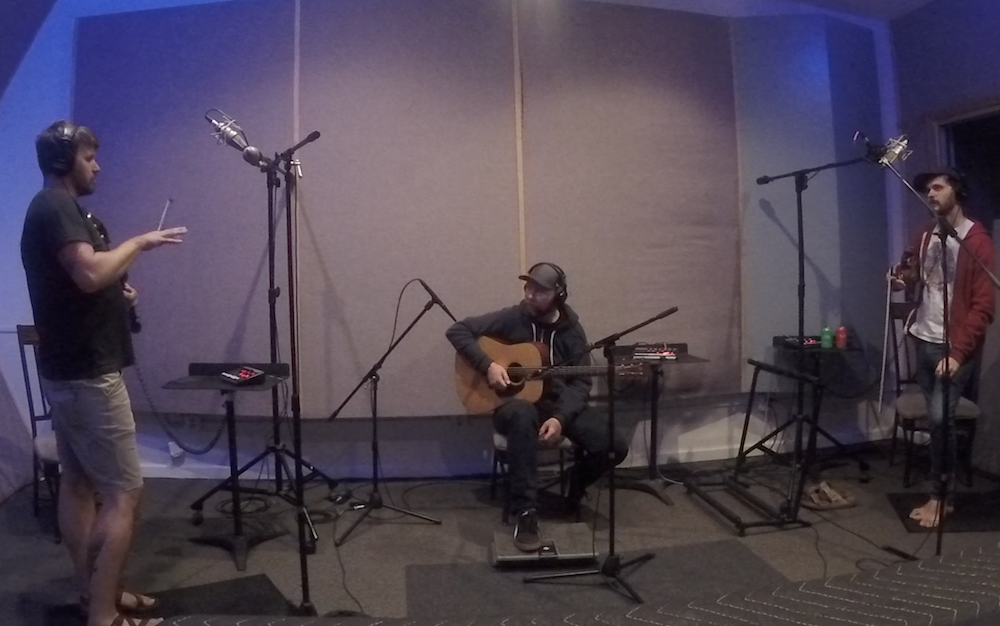
However, as artists as well as scientists, we also recognize and value the aesthetics of volcanism. We created a musical interpretation of the data, Adam Roszkiewicz playing a ‘prepared’ guitar with erasers and paper clips attached to the strings, John Mailander and Leif Karlstrom playing violin, and Ethan Jodziewicz playing a ‘prepared’ bass with paper stuffed in between the strings). We worked with recording engineer Daniel Rice at his studio in Nashville Tennessee, the four performers crowded in a room around a stereo pair of microphones. The sonified data was piped into headphones and we played spontaneously in response to the sounds as well as each other – no rehearsal, no key or meter, just free improvisation of the kind made popular by jazz artists like Ornette Coleman or John Zorn. You can hear that the playing takes on a life of its own: we react at different rates and different ways, and don’t stop playing quite in time with the data. But, we engage with the patterns of sound created by the volcanic data and this generates musical moments.
Visualization
A final element of “Hotel Kilauea” brings the sonified – and then musically abstracted – volcanic data one step farther, by animating both the datasets and the musical interpretation. Digital artist Zack Marlow-McCarthy used a 3D digital elevation model of the Kīlauea volcano as a basis for pointillistic expression of the data, rendering different visual elements for each of the three data streams. Rather than map the data directly onto an image, Zack took some artistic license that retains key elements of the data. The GPS data enters through long-wavelength destabilizations of the volcano, while the Deflation-Inflation events enter as discrete bursts of color, and SO2 gas emissions rise out of the Halema’uma’u crater as beams of red light.
To close the loop between representation of the data and artistic interpretation, Zack also included a visual element associated with the music. Subtle deformation of the volcano occurs in response to the improvised music: a blurring of the difference between reality and interpretation, or a nod to the imprecise and ambiguous reality of scientific story telling.
References
1Poland, Michael P., et al. "A mantle-driven surge in magma supply to Kīlauea Volcano during 2003–2007." Nature Geoscience 5.4 (2012): 295.
2Neal, C. A., et al. "The 2018 rift eruption and summit collapse of Kīlauea Volcano." Science 363.6425 (2019): 367-374.
3Anderson, Kyle R., et al. "Episodic deflation–inflation events at Kīlauea Volcano and implications for the shallow magma system." Hawaiian Volcanoes: From Source to Surface 208 (2015): 229.