Sonification and animation of geyser eruptions
Want more details after watching the movie?
Check out the 2021 Computer Music Journal article!
Or read on for a non-technical summary...
by Anna Barth
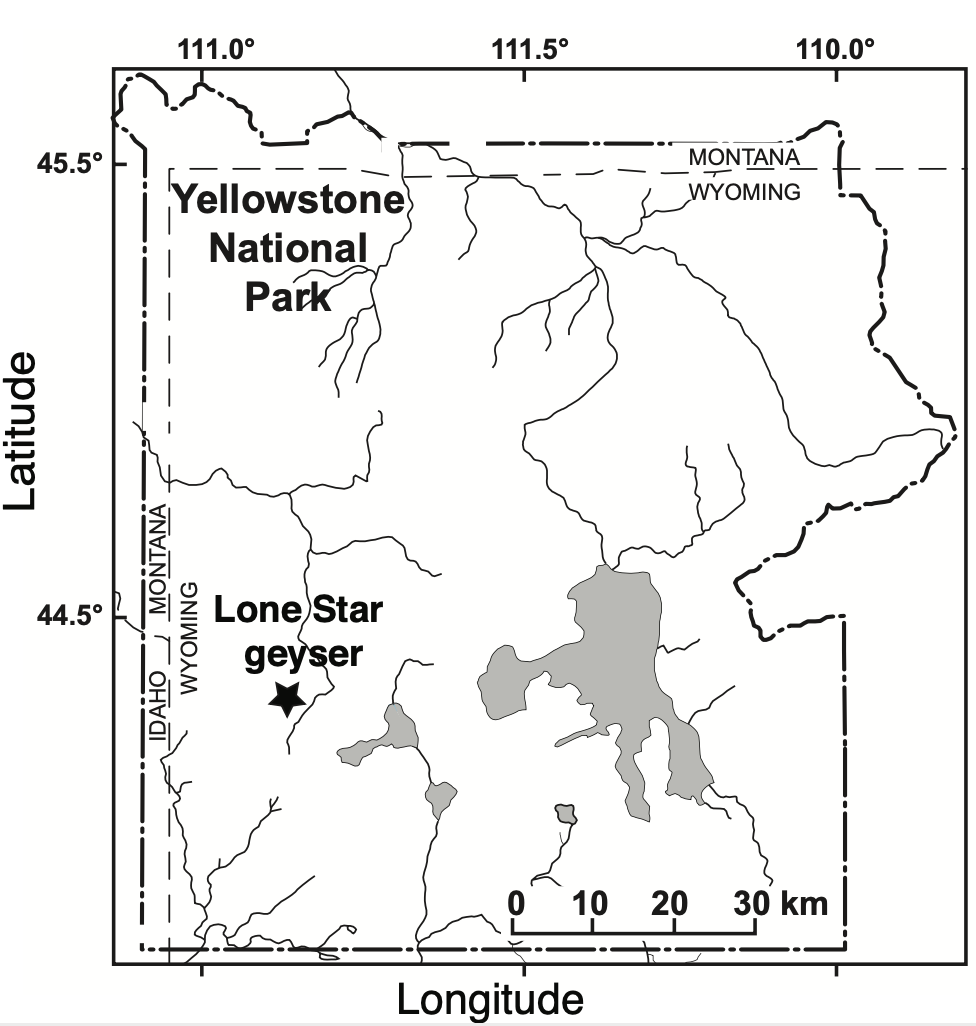
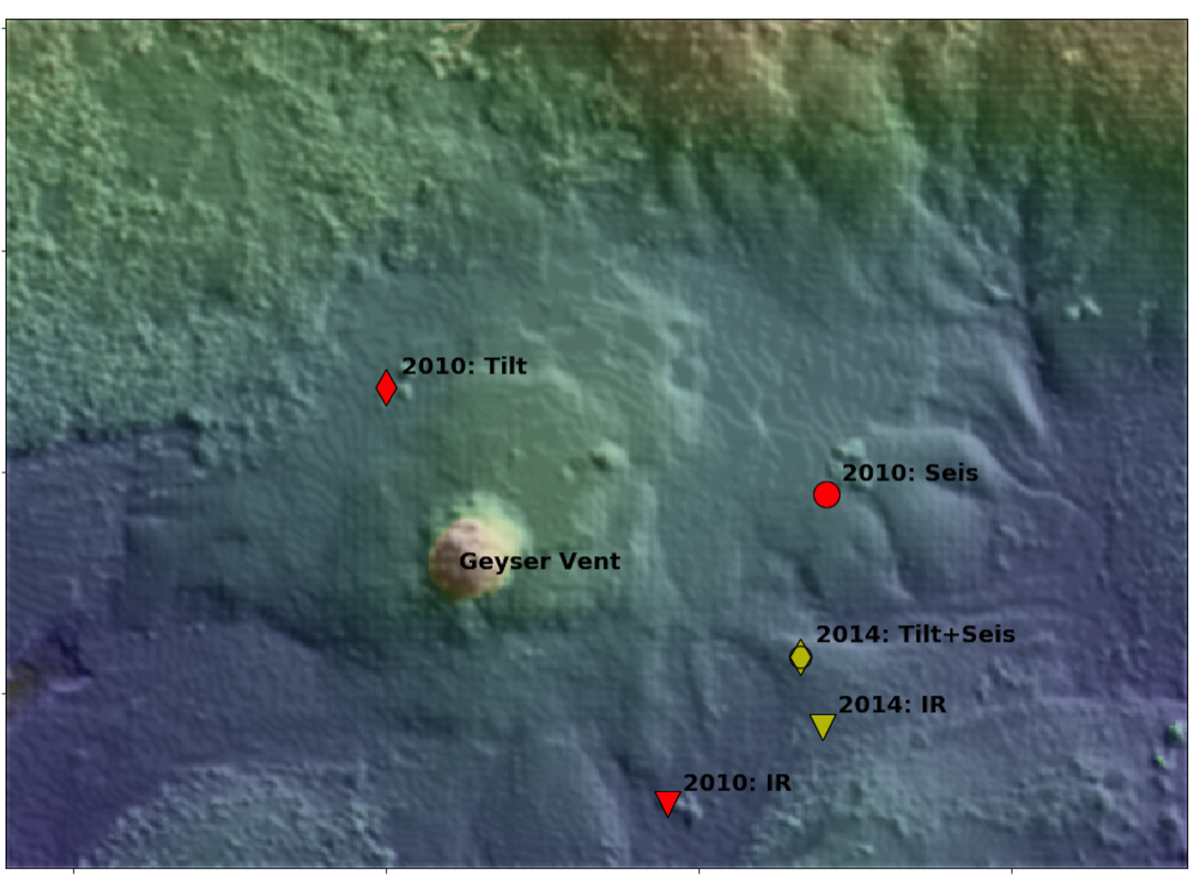
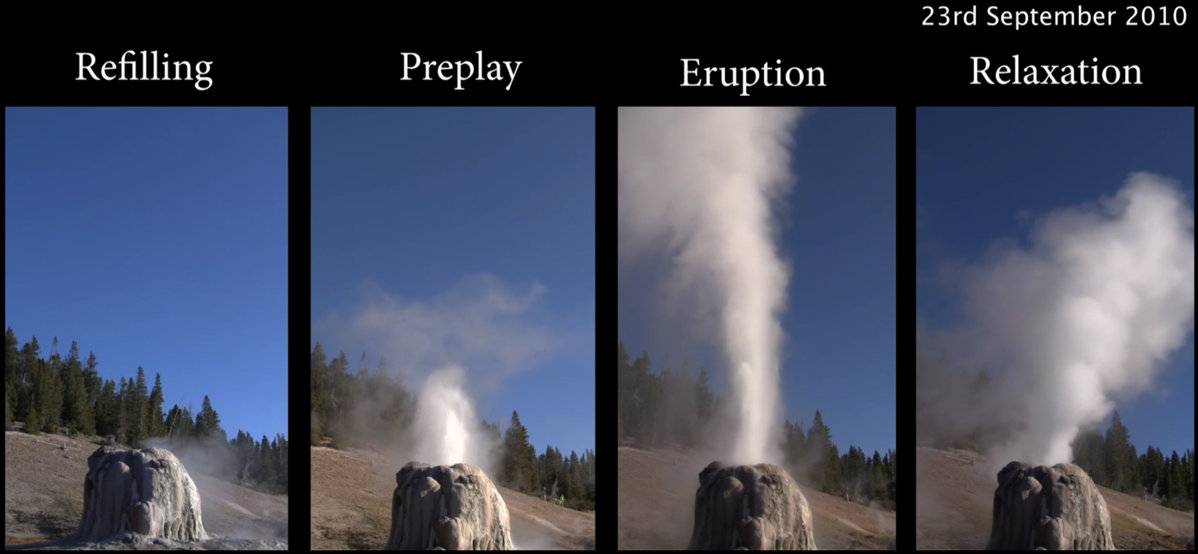
Geysers rare hydrothermal features that episodically erupt liquid and gas. Lone Star geyser in Yellowstone National Park erupts remarkably regularly — approximately every three hours. The eruption cycle is characterised by four main phases: eruption, relaxation, recharge, and preplay (Karlstrom et al., 2013). Field experiments in 2010 and 2014 monitored the geyser with a variety of sensors: seismometers to detect subsurface seismic tremor, tilt meters to measure longer timescale ground deformation, and infrared (IR) sensors to measure the temperature at the geyser vent. These different types of monitoring data reflect different aspects of the geyser system and looking at (/listening to!) the relationships between these different data may reveal information about processes driving the eruptions.
We use different sonification techniques for each data type. Since seismic data has an oscillatory nature, we simply speed up the seismic data so that the oscillations are within our audible range (speed factor of ~600). Using a technique call polarisation analysis, we can tell approximately where the seismic tremor signal is located beneath the geyser (following Vandemeulebrouck et al., 2014). We pan the tremor sound between the left and right channels to indicate its location.
Let’s take a listen!
You may be able to hear a persistent source of tremor in the right headphone channel, which migrates over to the left channel in short bursts during the preplay stage. It is likely that the tremor is caused by oscillations related to the formation or collapse of bubbles in the water. Migrating location and varying amplitude of tremor may be tracking the boiling front of the water!
For the tilt data, we map the position of the ground to an octatonic scale, starting at a frequency of 77.78 [Hz], or D#1. Inflation of the ground, perhaps due to fluid influx and increased pressure, is heard as ascending notes, while deflation is heard as descending notes.
Let’s take a listen!
The ascending scales typically lead up to the ‘hisses’ of the seismic data (preplay). These inflation signals may reflect increased pressure beneath the surface due to the accumulation of fluids.
Finally, for the IR data, we use a technique called ‘Granular synthesis’ (Garton and Topper 1997). The sound is made up of many individual sound ‘grains’ — a sort of sonic version of the painting technique, “pointillism”. Changing the properties of the collection of grains (e.g. amplitude, pitch) controls the overall quality of the sound. We change the amplitude, pitch centre (average pitch of the grains at a given time) and pitch jitter (spread in pitches around the pitch centre) to highlight the different eruption phases.
Let’s take a listen!
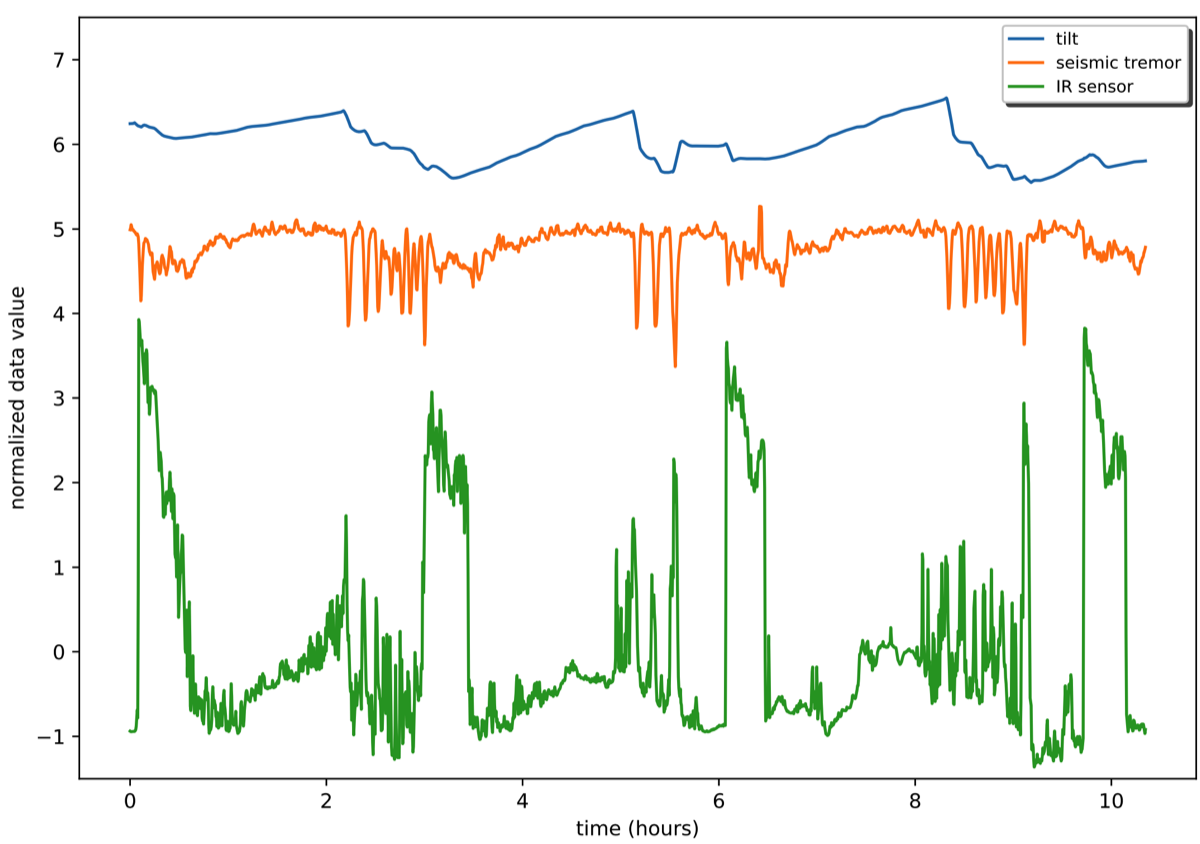
Since the different data tracks all have quite different characteristics, when they’re played simultaneously, it is possible to distinguish between them. Below, you can listen to three eruption cycles from the experiment in 2010. Can you hear how the different data types change over the course of the eruption cycle? What are the repeatable features of the cycles and what are the more random features?
2010 sounds all together below:
Remix
As a final step, we do some sound engineering in Ableton to enhance separation of the sounds and improve the aesthetics of listening. At this stage, we're crossing over into sound art and computer music... but everything is data driven!
Processing steps:
Seismic data (LEFT) - isolated the left side of the stereo image and added a small amount of EQ and compression.
Seismic data (RIGHT) - isolated the right side of the stereo image and added some EQ and compression and used a vocoder with white noise as the carrier.
IR data - EQ, parallel compression, slight pitch shifting/chorus, cut out the three quieter sections to a new track, EQ and added slight reverb.
Tilt data - EQ to remove harsh frequencies, add some sub harmonics (treating as a bass instrument) and added some compression to even out the dynamic range.
Remix by Adam Roszkiewicz
To explore the longer term stability of the processes driving eruptions at Lone Star geyser, we can compare these three eruption cycles in 2010 with three eruption cycles in 2014. Please watch the storyboarded movie at the top of the page for this exercise.
The similarity between 2010 and 2014 cycles suggests that Lone Star geyser is relatively stable on the timescale of years. Yet, there are also some differences between years. In 2014 there were no platform tilt-meters so long period ground deformation was derived from low-pass filtering of the seismic data. Listen for differences in the tilt data from 2010 and 2014 — some of this may be process-related while some may reflect differences in instrumentation.
This data was collected under Yellowstone National Park permit YELL-SCI-5826
References
Barth, A., L. Karlstrom, B. Holtzman, A. Pate, A. Niyak, 2021, "Sonification and Animation of Multivariate Data to Illuminate Dynamics of Geyser Eruptions", Computer Music Journal, 44 (1): 35–50, https://doi.org/10.1162/comj_a_00551
Garton, B., and D. Topper. 1997. “RTCmix - Using Cmix in real time.” Proceedings of the International Computer Music Conference :309–402.
Karlstrom, L., S. Hurwitz, R. Sohn, J. Vandemeulebrouck, F. Murphy, M. L. Rudolph, M. J. S. Johnston, M. Manga, and R. B. McCleskey. 2013. “Eruptions at Lone Star Geyser, Yellowstone National Park, USA, Part 1: Energetics and Eruption Dynamics.” Journal of Geophysical Research 118:1–15.
Vandemeulebrouck, J., R. A. Sohn, M. L. Rudolph, S. Hurwitz, et al. 2014. “Eruptions at Lone Star Geyser, Yellowstone National Park, USA, part 2: Constraints on subsurface dynamics.” Journal of Geophysical Research (doi: 10.1002/2014JB011526).